Quantifying the Invisible: Building a Maintainability Dashboard for Your Codebase

Every engineering team has encountered that one piece of code. It works - technically. It passes tests (most of the time), delivers value, and quietly sits in production like a ticking time bomb wrapped in good intentions.
Ask a developer about it, and the response is often the same: “It’s a bit messy, but it’s fine… for now.”
Multiply that sentiment across an entire codebase, and suddenly “fine” becomes fragile. Technical debt accumulates silently. Maintainability erodes gradually. And before long, even small changes feel like navigating a maze with invisible walls.
The problem is not just the existence of technical debt - it is the inability to quantify and communicate it effectively. Without visibility, teams struggle to prioritize refactoring, and stakeholders struggle to understand why it matters.
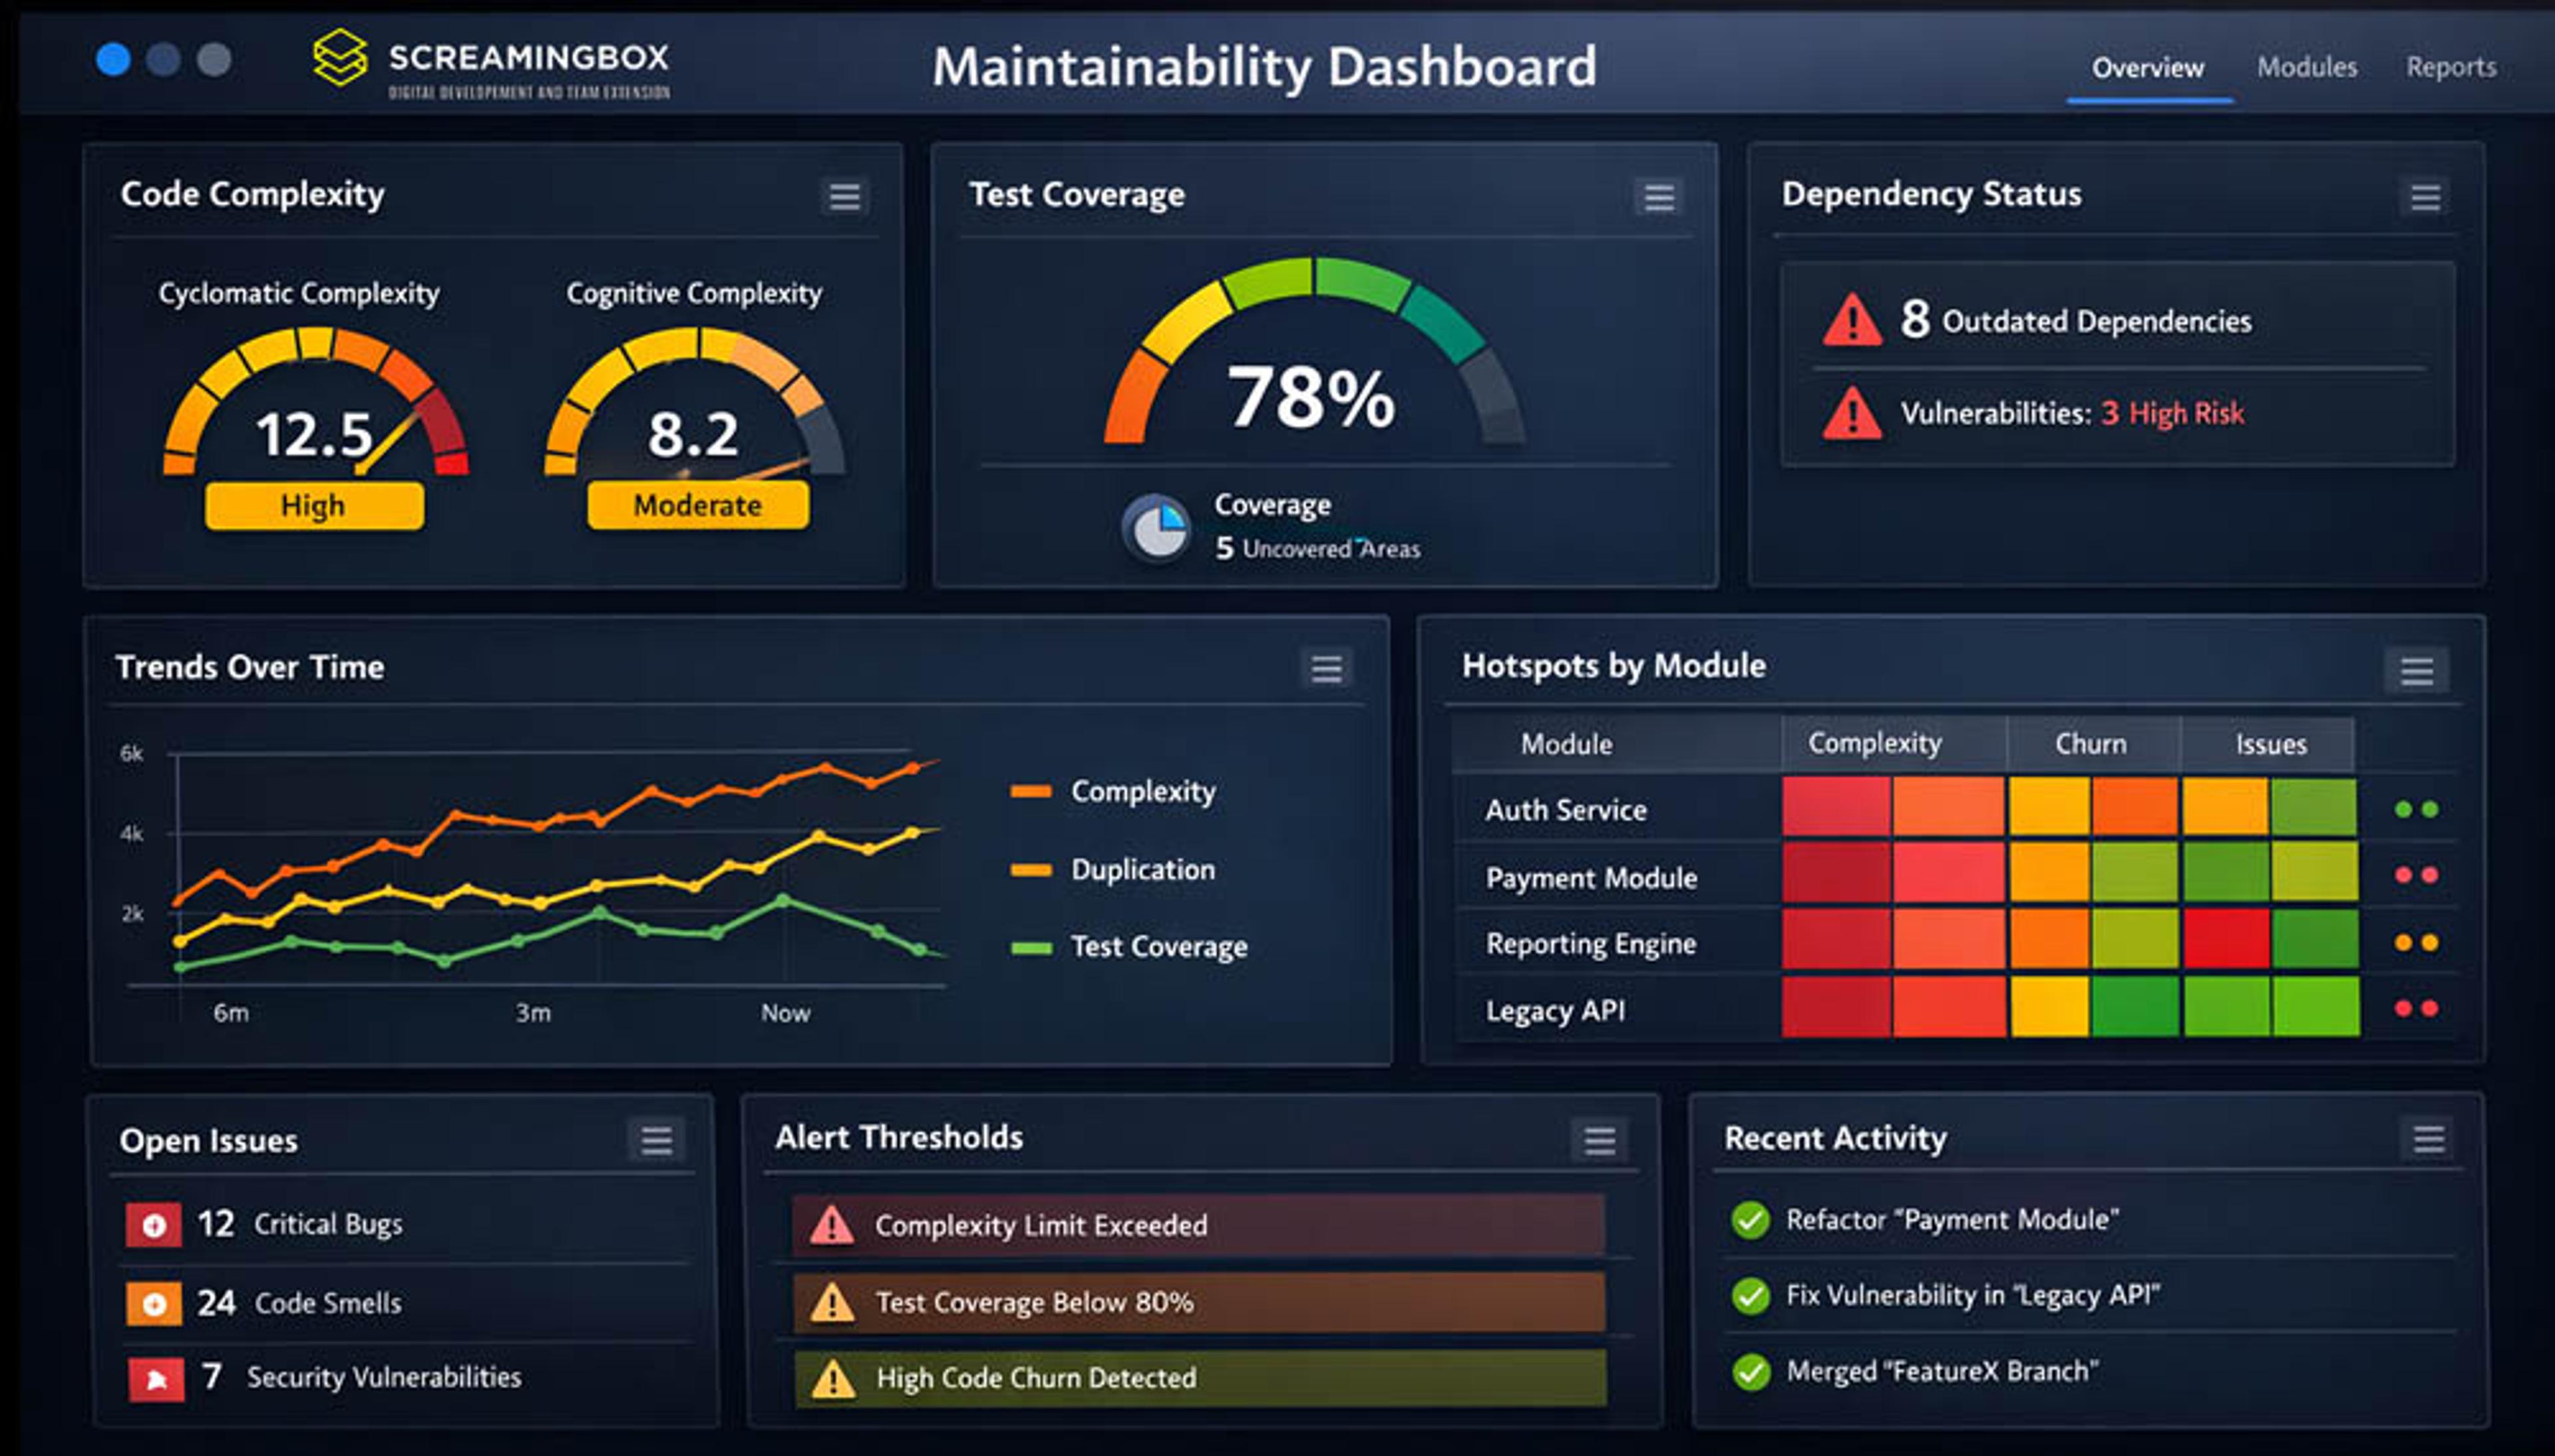
This is where a maintainability dashboard becomes invaluable. By combining static code analysis with clear, visual reporting, organizations can transform abstract code quality concerns into actionable insights.
This article explores how to build a maintainability dashboard that makes code health measurable, understandable, and strategically actionable.
Why Maintainability Is Hard to Measure?
Maintainability is inherently abstract. Unlike performance metrics or uptime, it does not present itself as a single, easily measurable value. You can call it “The Intangible Nature of Code Quality” - since it is a little like some of the unknown mysteries of the Universe.
Although the challenge really comes from how difficult it is to measure - because it emerges from a complex blend of many different inputs and conditions - code health is shaped by several intertwined factors.
Elements such as code complexity, duplication, test coverage, documentation quality, and dependency management all play a role. Each one influences maintainability in its own way, yet none of them can fully capture the state of a codebase on its own.
The Communication Gap
One of the biggest challenges is translating technical insights into business value.
Developers may recognize increasing complexity or poor structure, but non-technical stakeholders often see only delivery timelines and feature output. Without a shared language or visual representation, conversations about refactoring can feel subjective or speculative.
A maintainability dashboard bridges this gap by turning qualitative concerns into quantitative data.
What Is a Maintainability Dashboard?
A maintainability dashboard can be set-up as a single source of truth for Code Health, andaggregates metrics from static code analysis tools and presents them in a centralized, visual format.
Its purpose is to:
- Provide real-time visibility into code quality
- Highlight areas of risk or degradation
- Support data-driven decision-making
- Communicate technical debt in business terms
Rather than relying on intuition, teams gain an objective view of their codebase.
Key Benefits
A well-designed dashboard enables organizations to:
- Prioritize refactoring efforts based on measurable impact
- Track trends over time to identify improvement or decline
- Align technical and business stakeholders around shared metrics
- Reduce long-term maintenance costs through proactive management
Core Metrics to Include in a Dashboard
A strong Maintainability Dashboard depends on the right set of core metrics - signals that reveal the true health, stability, and long‑term sustainability of a codebase. These metrics turn scattered engineering activity into clear, actionable insight, helping teams understand where risks are emerging, where quality is improving, and where focused investment will have the greatest impact.
Code Complexity Metrics
Code complexity is a key part of any Maintainability Dashboard because it shows how hard a codebase is to understand, modify, and test, helping teams spot risks before they slow development.
Cyclomatic Complexity - One of the most common measures is Cyclomatic Complexity; which reflects the number of independent paths through a function - for instance, a routine packed with nested if/else branches quickly becomes harder to test and more prone to bugs. By tracking complexity trends, teams can identify trouble spots early and make smarter decisions about where refactoring will have the greatest impact.
Cognitive complexity - This measurement approaches the problem from a different angle by focusing on how difficult code is for a human to understand. It reflects the mental effort required to follow the logic, especially when the flow is deeply nested or conceptually dense. A function that chains several transformations - such as mapping, filtering, and reducing data in a single expression - might have a low cyclomatic score but still be cognitively demanding because the reader must mentally simulate each step to grasp the final result.
When used together, cyclomatic and cognitive complexity provide a more complete picture of maintainability. Cyclomatic complexity highlights structural risk and testing difficulty, while cognitive complexity exposes code that may be simple in structure yet still confusing to reason about. A Maintainability Dashboard that incorporates both gives teams a sharper, more actionable understanding of where complexity truly resides and how to address it before it becomes a barrier to progress.
Code Duplication Metrics
Duplicate code increases maintenance overhead and introduces risk. A change in one location must be replicated elsewhere, increasing the chance of inconsistency.
A dashboard should highlight:
- Percentage of duplicated code
- High-risk modules with excessive duplication
Test Coverage Metrics
reflects how much of the codebase is exercised by automated tests, offering a sense of confidence when making changes and highlighting areas that may carry hidden risk if left untested.
It isn’t a direct measure of quality, but it does reveal where the safety net is strong and where gaps exist - for instance, a critical module with only minimal test coverage leaves teams vulnerable to regressions whenever they modify it.
Interpreting this metric in context is essential, since high coverage doesn’t guarantee maintainability, yet consistently low coverage is often an early warning sign of trouble.
Code Churn Metrics
Code churn measures how frequently code is modified over time.
High churn in specific areas may indicate:
- Unstable design
- Poor initial implementation
- Frequent bug fixes
Combining churn data with complexity metrics helps identify hotspots that require attention.
Dependency Health Metrics
Modern applications depend heavily on external libraries and frameworks, which means the health of a codebase is closely tied to the health of its dependencies. When those dependencies become outdated or contain known vulnerabilities, they introduce security risks and make long‑term maintenance more difficult.
A dashboard that tracks how current these components are helps teams understand where they may be relying on unsupported or risky versions.
A practical example is a service built on an older version of a popular web framework: even if the application itself is stable, running on a framework with several unpatched security issues or infrequent updates exposes the system to avoidable threats. By monitoring the number of outdated packages, the severity of known vulnerabilities, and how often dependencies receive updates, teams can proactively address risks before they escalate into operational or security problems.
Tools for Static Code Analysis
Static code analysis tools form the backbone of any effective Maintainability Dashboard because they provide the objective, repeatable measurements needed to understand code quality at scale. When combined with information from CI pipelines and version control systems, they create a unified, comprehensive view of code health that teams can rely on to guide improvement efforts
Popular Platforms
Several tools can feed data into a maintainability dashboard:
- SonarQube : Provides comprehensive code quality metrics, including complexity, duplication, and technical debt estimation
- Code Climate : Focuses on maintainability and test coverage insights
- ESLint / Stylelint : Enforce coding standards and detect issues in JavaScript and CSS
- PMD / Checkstyle : Analyze Java code for potential problems
These tools generate the raw data needed to build meaningful visualizations.
Integrating Multiple Data Sources
A robust dashboard often aggregates data from multiple tools.
For example:
- Static analysis tools for code quality
- CI/CD pipelines for build and test metrics
- Version control systems for churn and commit history
Integration ensures a comprehensive view of code health.
Designing an Effective Dashboard
Designing an effective Maintainability Dashboard starts with understanding that its purpose is not to impress with visual complexity, but to give teams a clear, trustworthy view of code health. The best dashboards surface the signals that matter most, reduce noise, and make it easy for engineers and leaders to understand where attention is needed and how the codebase is evolving over time.
Prioritize Clarity Over Complexity
A strong dashboard prioritizes clarity over volume. Rather than displaying every available metric, it focuses on simple, intuitive visualizations - such as trend lines, heatmaps, or lightweight charts - that highlight the most important indicators of maintainability. The goal is to avoid overwhelming users with data and instead guide them toward the insights that support better engineering decisions.
Highlight Trends, Not Just Snapshots
Equally important is emphasizing trends rather than isolated snapshots. A single metric at a single moment tells very little; the real value comes from seeing whether complexity is rising, duplication is creeping upward, or test coverage is gradually declining. These patterns reveal whether the codebase is improving or deteriorating and help teams act before small issues become systemic problems.
Use Thresholds and Alerts
Dashboards also become far more actionable when they incorporate thresholds and alerts. Setting clear limits - such as complexity exceeding a defined boundary, coverage falling below an acceptable level, or churn spiking unexpectedly - helps teams know exactly when intervention is required. Automated notifications ensure that emerging risks are addressed promptly rather than discovered too late.
Segment by Module or Team
Finally, segmenting metrics by module, service, or team makes the dashboard significantly more useful. This level of granularity supports targeted refactoring, encourages accountability, and helps organizations allocate resources where they will have the greatest impact. A dashboard that can zoom from the big picture down to specific components becomes a powerful tool for continuous improvement.
Turning Metrics into Action

Turning metrics into action is where a Maintainability Dashboard proves its real value. Collecting data is only the first step - what matters is how teams use that information to guide refactoring, communicate risks, and improve development workflows.
By translating raw signals into clear priorities, meaningful conversations, and automated safeguards, organizations can ensure that maintainability becomes an active part of everyday engineering practice rather than an afterthought.
Prioritizing Refactoring Efforts
Not all technical debt is equal. A maintainability dashboard helps teams focus on high-impact areas. A practical approach includes:
- Identifying high-complexity, high-churn modules
- Assessing business criticality
- Prioritizing refactoring based on risk and value
This ensures that efforts deliver meaningful improvements.
Communicating with Non-Technical Stakeholders
Dashboards play a critical role in bridging the communication gap. Instead of abstract discussions, teams can present:
- Visual trends showing declining maintainability
- Quantified technical debt estimates
- Risk indicators tied to business outcomes
This enables more informed decision-making at the leadership level.
Embedding Metrics into CI/CD Pipelines
To maintain accuracy and relevance, dashboards should be continuously updated. By integrating metrics into CI/CD pipelines, it ensures:
- Real-time data collection
- Immediate feedback on code changes
- Enforcement of quality gates
This aligns maintainability with the development workflow.
Common Pitfalls to Avoid
Even the best dashboards can lose their value if teams fall into common traps that distort insights or prevent meaningful action. Understanding these pitfalls helps ensure that metrics remain accurate, contextual, and genuinely useful, rather than becoming misleading signals or ignored data points. By recognizing where dashboards often go wrong, teams can build practices that keep maintainability efforts focused and effective.
Over-Reliance on Single Metrics
Teams often run into trouble when they rely too heavily on a single metric to judge maintainability. No single number - whether it’s test coverage, complexity, or churn - can capture the full health of a codebase. For example, a service might boast 90% test coverage, but if those tests are shallow or brittle, the high number creates a false sense of security. A balanced view is essential to avoid drawing misleading conclusions.
Ignoring Context
Context is another area where dashboards can be misinterpreted. Metrics only become meaningful when teams understand the story behind them. High complexity in a core algorithm, for instance, may be entirely justified if the logic is inherently intricate and well‑tested. Similarly, a temporary spike in churn might simply reflect an active feature rollout rather than instability. Without understanding the “why,” teams risk overreacting to normal development patterns.
Failing to Act on Insights
The final pitfall is failing to act on the insights a dashboard provides. Metrics lose their value if they aren’t tied to clear processes for review and improvement. Consider a team that repeatedly sees rising duplication in a critical module but never assigns ownership to address it; over time, the problem compounds and slows development. Dashboards must feed into regular reviews, defined responsibilities, and ongoing tracking so that insights translate into real progress rather than becoming decorative charts on a screen.
Real-World Scenario: Making the Invisible Visible
Consider a mid-sized SaaS company experiencing slower release cycles and increasing bug rates. Developers suspected growing technical debt, but leadership lacked visibility into the issue.
By implementing a maintainability dashboard, the company:
- Identified a small number of high-risk modules responsible for most issues
- Reduced code complexity in critical areas by 30%
- Improved deployment frequency and stability
The dashboard transformed vague concerns into measurable outcomes, enabling targeted improvements.
Best Practices for Long-Term Success
Start Small and Scale
Begin with a core set of metrics and expand as needed. Early success builds momentum and adoption.
Align Metrics with Business Goals
Ensure that maintainability metrics support broader organizational objectives, such as:
- Faster time to market
- Reduced operational risk
- Improved customer experience
Foster a Culture of Continuous Improvement
Encourage teams to view metrics as tools for improvement, not judgment.
This promotes:
- Transparency
- Collaboration
- Ongoing optimization
Conclusion: Turning Code Health into a Strategic Asset

Maintainability may be invisible, but its impact is anything but. Left unmanaged, it erodes productivity, increases risk, and slows innovation. Yet when properly measured and visualized, it becomes a powerful lever for improvement.
A maintainability dashboard provides the clarity needed to quantify technical debt, prioritize refactoring, and communicate effectively with stakeholders. It transforms subjective concerns into objective insights and aligns technical decisions with business outcomes.
For organizations seeking to modernize their development practices, the next step is clear: implement a maintainability dashboard that integrates with existing tools and workflows. Start by identifying key metrics, visualize trends, and embed these insights into daily operations.
In doing so, teams can move beyond “it works… mostly” and toward a codebase that is not only functional, but sustainable, scalable, and strategically sound.
For more information about managing code maintainability, or having us work on your software projects, please feel free to contact ScreamingBox .
Check out our Podcast on Scaling SaaS Product Development and Engineering - for a deeper look at development engineering and technical debt .
ScreamingBox's digital product experts are ready to help you grow. What are you building now?
ScreamingBox provides quick turn-around and turnkey digital product development by leveraging the power of remote developers, designers, and strategists. We are able to deliver the scalability and flexibility of a digital agency while maintaining the competitive cost, friendliness and accountability of a freelancer. Efficient Pricing, High Quality and Senior Level Experience is the ScreamingBox result. Let's discuss how we can help with your development needs, please fill out the form below and we will contact you to set-up a call.